The Gini Coefficient: Measuring Extreme Token Concentration in Crypto Governance
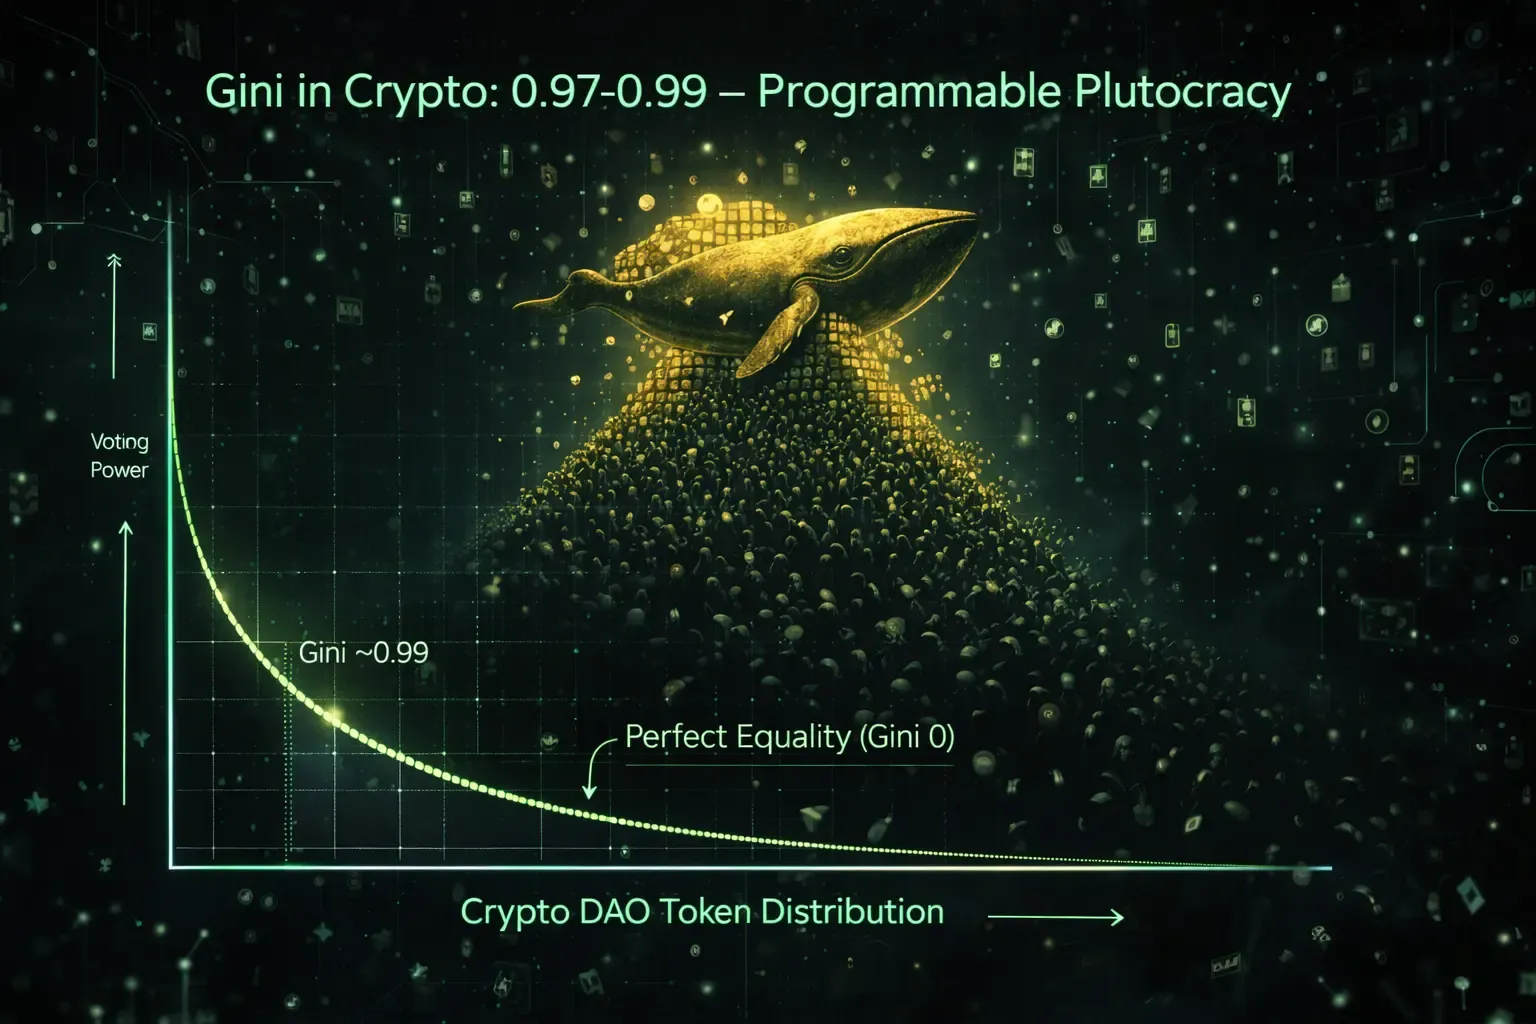
The Gini coefficient measures inequality (0=perfect equality, 1=total inequality). Derived from the Lorenz curve, it reveals extreme token concentration in crypto DAOs: 0.97-0.99 Gini—far worse than any nation (South Africa ~0.63). This exposes programmable plutocracy in governance.

December 26, 2025. The metric that exposes crypto's hidden plutocracy.
The Gini coefficient keeps surfacing in governance analyses because it quantifies the hyper-concentration that raw holder counts obscure. DAO tokens routinely hit 0.97–0.99 while no real-world nation exceeds ~0.63. This isn't coincidence—it's the mathematical signature of programmable inequality.
What the Gini Coefficient Actually Measures
Standard economic metric for statistical dispersion in any distribution—income, wealth, land, or governance tokens.
0 = perfect equality: every holder owns exactly the same amount.
1 = perfect inequality: one entity holds 100%, everyone else 0.
Real-world benchmarks: Most developed nations 0.24–0.40. Highest national income inequality: South Africa ~0.63. Nothing in traditional finance approaches 0.9+.
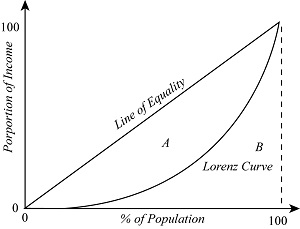
Foundation: The Lorenz Curve
Source: homework.study.com

Source: homework.study.com
Sort holders from poorest to richest. Plot cumulative percentage of population (x-axis) against cumulative percentage of total holdings (y-axis).
The 45° diagonal = perfect equality.
The farther the curve bows toward the bottom-right corner, the higher the inequality.
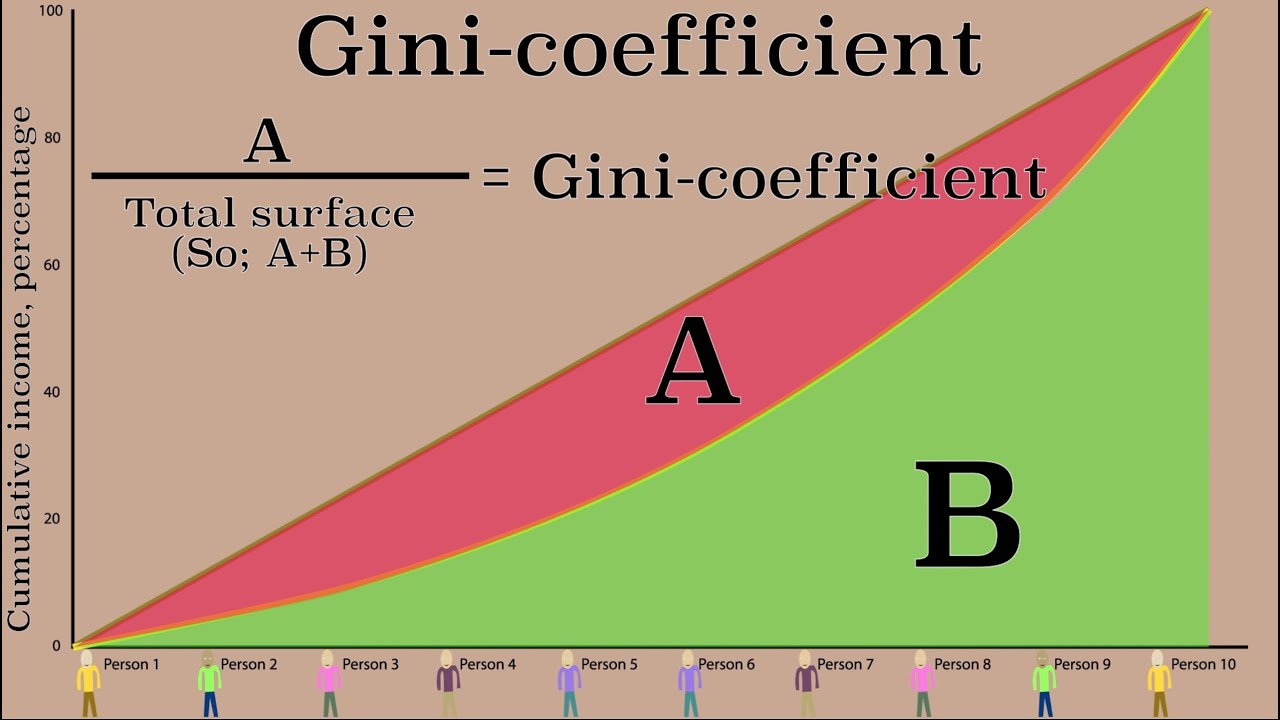
Gini = Area A (between equality line and curve) ÷ Total area under equality line (A + B).
Extreme Case: What 0.99 Looks Like
Source: YouTube (educational video thumbnail)
In a near-1 Gini scenario, the curve hugs the bottom axis almost entirely—99% of holders control close to 0%, while the final fraction of whales captures nearly everything.
Real-World Nations vs Crypto Tokens

Source: Wikimedia Commons / World Bank data
Darkest red on global maps: ~0.60. OECD average: light green ~0.30. No country reaches crypto's routine 0.97–0.99 zone.
Gini in Major DAO Tokens (2024–2025 Data)
Cambridge Centre for Alternative Finance DeFi Navigator + DeepDAO aggregates:
Maker/Sky: ~0.99
Uniswap: 0.97–0.98
Aave: ~0.98
Lido: 0.97+ post-consolidation
Top 10 DeFi DAOs all cluster 0.97–0.99.
Post-airdrop power-law accumulation in speculative markets drives this outcome predictably.
Signal: One Number Cuts Through the Hype
When governance tokens score higher inequality than any dystopian economy, claims of "decentralized sovereignty" collapse under their own math. Gini doesn't lie—it's the cold proof of embedded plutocracy.
Strategic Decision Lens: Why Whales & Institutions Accumulate to Extreme Gini Levels
The Gini coefficient quantifies the outcome: programmable plutocracy at 0.97–0.99. Strategic decision theory explains the process: why actors (whales, VCs, institutions) rationally drive concentration under uncertainty, cognitive limits, and asymmetric incentives (bounded rationality à la Simon + prospect theory à la Kahneman).
Key dilemma for large holders: Accumulate further (maximize control & upside) or diversify/exit (hedge risk, reduce exposure)? In crypto's power-law markets, the utility tree branches as follows:
- Option A – Accumulate / HODL: Buy more on dips, delegate, or proxy-vote treasuries → exponential control gains if token appreciates. Reference point anchored on past pumps (e.g., post-airdrop runs). Prospect theory: aversion to regret ("missing the next 10x") outweighs potential losses from concentration risk. Result: myopic reinforcement of Gini escalation.
- Option B – Diversify / Partial Sell: Spread holdings across assets/protocols → lower Gini impact, but opportunity cost high in bull markets. Bounded rationality blocks optimal allocation: cognitive overload from tracking multiple chains, plus endowment effect (overvaluing held tokens).
- Option C – Exit / Dump: Sell large positions → immediate liquidity, but triggers price impact + regret if rebound follows. High friction: tax events, slippage, perceived "betrayal" of community. Most common only under extreme pressure (e.g., regulatory clamps).
Institutions (BlackRock-style) amplify this: delegated stakes via compliant rails yield high utility per unit risk (regulatory cover + yield). Small holders face opposite asymmetry: low conviction + high relative gas/UI costs → abstain, further concentrating power.
Matrix of key trade-offs (simplified AHP-style weighting for whale/institutional perspective, 2025–2026 priors):
| Factor | Weight | Accumulate Score | Diversify Score | Net for Whale |
|---|---|---|---|---|
| Control / Influence upside | 40% | High (power-law gains) | Low | + |
| Regret aversion (missing pumps) | 30% | Low risk of regret | High (FOMO) | + |
| Regulatory / liquidation risk | 20% | High (concentration visible) | Lower | - |
| Cognitive / operational cost | 10% | Low (simple HODL) | High (multi-asset mgmt) | + |
Net: accumulation is the dominant strategy under current incentives — especially with post-airdrop power-laws and institutional entry via proxies. This drives Gini toward 0.99+ unless countered by protocol-level dispersion (quadratic voting, conviction, soulbound). Bounded rationality + loss/regret biases lock in the theater: whales choose control over equity because the costs feel abstract until capture materializes.
Key insight: Gini isn't just a statistic — it's the aggregated result of thousands of bounded, prospect-biased decisions. Mechanism design must target decision architecture to break the cycle.
No hype. Signal only. Stay sovereign.
→ Read full article: DAO Governance 2025 — Programmable Plutocracy → Explore the full Crypto Governance Control Hub
Main Sources (as of late 2025):
- Cambridge Centre for Alternative Finance DeFi Navigator (2024–2025 updates): Gini 0.97–0.99 across top DeFi DAOs.
- World Bank / CIA World Factbook Gini datasets for national comparisons.
- DeepDAO and Chainalysis reports on token concentration.
- Standard economic literature (Lorenz 1905, Gini 1912) and modern blockchain analyses.
- Images: homework.study.com (Lorenz diagrams), Wikimedia Commons (World Gini map), YouTube educational content (extreme case illustration).